Getting started
This notebook showcases the main functionalities of tri3d. It can be run for any of the supported dataset.
[1]:
import k3d
import matplotlib.pyplot as plt
import numpy as np
from tri3d.datasets import Argoverse2, Waymo, ZODFrames
from tri3d.geometry import test_box_in_frame
from tri3d.misc import nearest_sorted
from tri3d.plot import (
gen_discrete_cmap,
plot_annotations_bev,
plot_bbox_cam,
plot_bboxes_3d,
to_k3d_colors,
)
Uncomment the desired dataset below to visualize another dataset. The rest of the notebook should run as-is thanks to the shared API.
[2]:
# dataset = Argoverse2("../../datasets/argoverse2", split="train")
# camera, image, lidar = "cam_ring_front_center", "img_ring_front_center", "lidar"
# dataset = NuScenes("../../datasets/nuscenes", "v1.0-mini")
# camera, image, lidar = "CAM_FRONT", "IMG_FRONT", "LIDAR_TOP"
# dataset = Once("../../datasets/once", "train")
# camera, image, lidar = "cam01", "img01", "lidar_roof"
# dataset = SemanticKITTI("../../datasets/semantickitti")
# camera, image, lidar = None, None, "velodyne"
dataset = Waymo("../../datasets/waymo", split="training")
camera, image, lidar = "CAM_FRONT", "IMG_FRONT", "LIDAR_TOP"
# dataset = ZODFrames(
# "../../datasets/zodframes",
# "trainval-frames-mini.json",
# "train",
# )
# camera, image, lidar = "front", "img_front", "velodyne"
if isinstance(dataset, Argoverse2): # waymo does not have segmentation for all frames
seq = 0
frame = 100
elif isinstance(dataset, Waymo): # waymo does not have segmentation for all frames
seq = 0
frame = dataset.frames(seq, sensor="SEG_LIDAR_TOP")[0]
elif isinstance(dataset, NuScenes):
seq = 5
frame = dataset.keyframes(seq, lidar)[13]
elif isinstance(dataset, ZODFrames):
seq = 1
ann_ts = dataset.timestamps(seq, sensor="boxes")[0]
frame = nearest_sorted(dataset.timestamps(seq, lidar), ann_ts)
else:
seq, frame = 1, 0
cam_frame = nearest_sorted(
dataset.timestamps(seq, camera), dataset.timestamps(seq, lidar)[frame]
)
Pose and calibration
In order to plot sensor poses, we first use Dataset.cam_sensors and Dataset.pcl_sensors to get the sensor names. The list of available frames for these sensors is given by Dataset.frames().
Using Dataset.poses() returns the poses of a given sensor at every sample frame available for that sensor. Poses are expressed in an arbitrary world coordinate system which is defined per sequence.
A pose is actually the geometric transform which takes a point in the sensor-local coordinates and returns it in world woordinates. In tri3d, poses are stored as instances of tri3d.geometry.Transform, which contain a batch of transformations (one for each frame). The geometric transformations objects support inversion, composition and, of course, application to 3D points.
[3]:
plot = k3d.plot(name="pcl", camera_mode="orbit", camera_auto_fit=False)
# select the first lidar pose as reference coordinates
p0 = dataset.poses(seq=seq, sensor=lidar)[0]
# iterate over sensors
for sensor in dataset.pcl_sensors + dataset.cam_sensors:
if len(dataset.timestamps(seq=seq, sensor=sensor)) == 0:
print(f"no data for sensor {sensor}")
continue
# get the sensor poses as a batched geometric transformation
poses = dataset.poses(seq=seq, sensor=sensor)
print(f"{sensor:15s} : {len(poses)} frames")
# express poses relative to p0 instead of world coordinates
poses = p0.inv() @ poses
# Get sensor positions at each frame by projecting [0, 0, 0].
# Note that [0, 0, 0] is automatically broadcasted to len(poses).
origins = poses.apply(np.zeros([3]))
# plot pose axes
for edge, color in zip(np.eye(3) * 0.2, [0xFF0000, 0x00FF00, 0x0000FF]):
# get axis vector by projecting [1, 0, 0], [0, 1, 0], [0, 0, 1]
vectors = poses.apply(edge) - origins
plot += k3d.vectors(
origins.astype(np.float32),
vectors.astype(np.float32),
color=color,
head_size=0.3,
group=sensor,
)
plot.camera = [6.44, -4.52, 3.66, 11.35, 6.17, -3.55, 0.0, 0.0, 1.0]
plot
LIDAR_TOP : 198 frames
LIDAR_FRONT : 198 frames
LIDAR_SIDE_LEFT : 198 frames
LIDAR_SIDE_RIGHT : 198 frames
LIDAR_REAR : 198 frames
CAM_FRONT : 198 frames
CAM_FRONT_LEFT : 198 frames
CAM_FRONT_RIGHT : 198 frames
CAM_SIDE_LEFT : 198 frames
CAM_SIDE_RIGHT : 198 frames
no data for sensor CAM_REAR_LEFT
no data for sensor CAM_REAR
no data for sensor CAM_REAR_RIGHT
[3]:
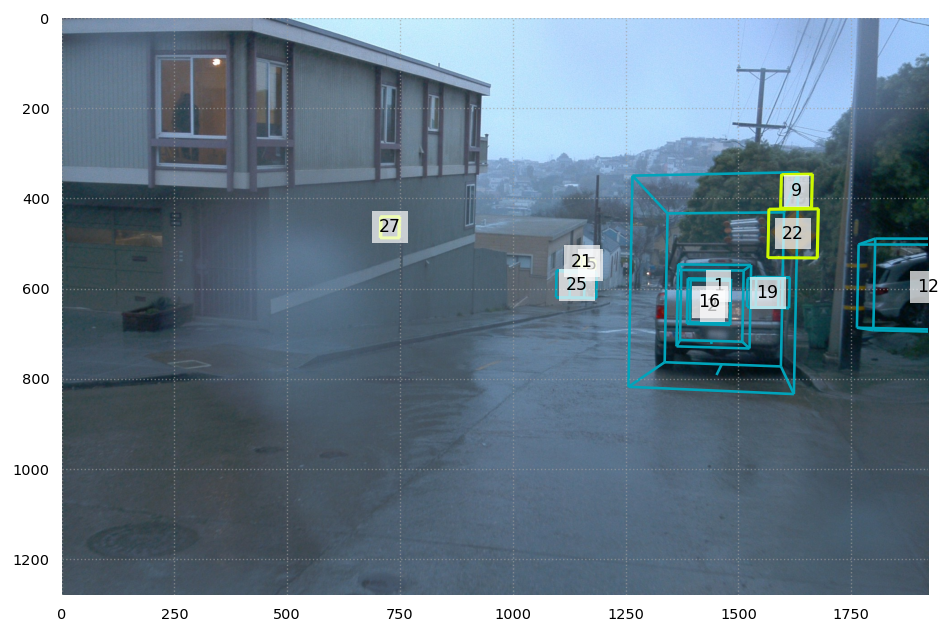
Annotations in frame
Requesting annotations in image coordinates will automatically interpolate and project annotations to the timestamps and coordinates of the camera.
Two helpers are used to reduce the boilerplate: tri3d.plot.test_box_in_frame and tri3d.plot.plot_bbox_cam.
[4]:
# retrieve image
sample_image = dataset.image(seq, cam_frame, sensor=camera)
# retrieve boxes in image coordinates, with trajectories interpolated
# at the image timestamp if necessary
sample_annotations = dataset.boxes(seq, cam_frame, coords=image)
[5]:
img_size = sample_image.size
cmap = gen_discrete_cmap(len(dataset.det_labels))
plt.figure(dpi=125, figsize=(10, 6))
plt.xlim((0, img_size[0]))
plt.ylim((img_size[1], 0))
plt.imshow(sample_image)
for i, ann in enumerate(sample_annotations):
# skip boxes where no vertex is in the frame
if test_box_in_frame(ann.transform, ann.size, img_size):
obj_id = str(getattr(ann, "instance", i))[:4]
hdg = ann.heading / np.pi * 180
color = cmap(dataset.det_labels.index(ann.label))
u, v, z = ann.center
print(f" {obj_id:4s}: {ann.label:20s} at {z:3.0f}m heading {hdg:+.0f}°")
# plot the bounding box
plot_bbox_cam(ann.transform, ann.size, img_size, ec=color)
# plot the uid
plt.text(
np.clip(u, 0, img_size[0]),
np.clip(v, 0, img_size[1]),
obj_id,
horizontalalignment="center",
verticalalignment="center",
bbox=dict(facecolor="white", linewidth=0, alpha=0.7),
)
1 : VEHICLE at 17m heading -16°
2 : VEHICLE at 28m heading -13°
5 : SIGN at 56m heading -194°
9 : SIGN at 21m heading -194°
12 : VEHICLE at 22m heading -102°
16 : VEHICLE at 47m heading -14°
19 : VEHICLE at 66m heading -8°
21 : SIGN at 66m heading +53°
22 : SIGN at 21m heading -194°
25 : VEHICLE at 76m heading -18°
27 : SIGN at 21m heading -195°
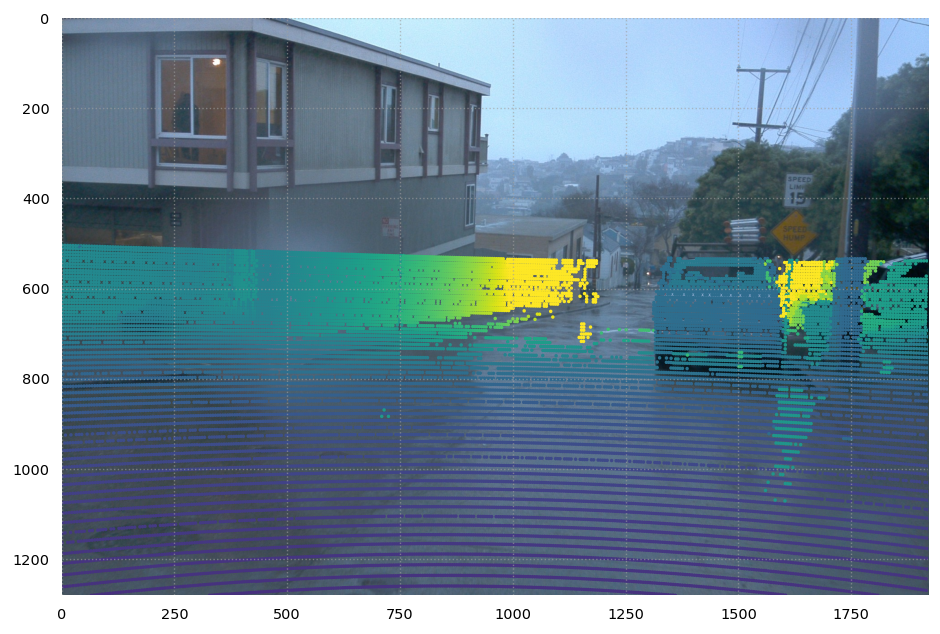
Lidar points over images
Requesting points in image coordinates will automatically compensate for ego car movement between the two sensor timestamps. It will also apply extrinsic and intrinsic calibrations.
[6]:
# Retrieve image.
sample_image = dataset.image(seq, cam_frame, sensor=camera)
# Retrieve points in image coordinates.
# The Lidar frame with the nearest timestamp will be used and ego car movement between
# the lidar and camera timestamps will be compensated.
points = dataset.points(seq, cam_frame, sensor=lidar, coords=image)
# Discard extra dims (intensity, etc.).
uvz = points[:, :3]
# Only keep points that are visible in the image.
in_frame = (
(uvz[:, 0] > 0)
& (uvz[:, 1] > 0)
& (uvz[:, 2] > 0) # in front of camera
& (uvz[:, 0] < sample_image.size[0])
& (uvz[:, 1] < sample_image.size[1])
)
uvz = uvz[in_frame]
[7]:
plt.figure(dpi=125, figsize=(10, 6))
plt.xlim((0, img_size[0]))
plt.ylim((img_size[1], 0))
plt.imshow(sample_image)
plt.scatter(uvz[:, 0], uvz[:, 1], c=uvz[:, 2], clim=(0, 40), s=1., alpha=1)
plt.xlim(0, sample_image.size[0])
plt.ylim(sample_image.size[1], 0)
plt.gca().set_aspect("equal")
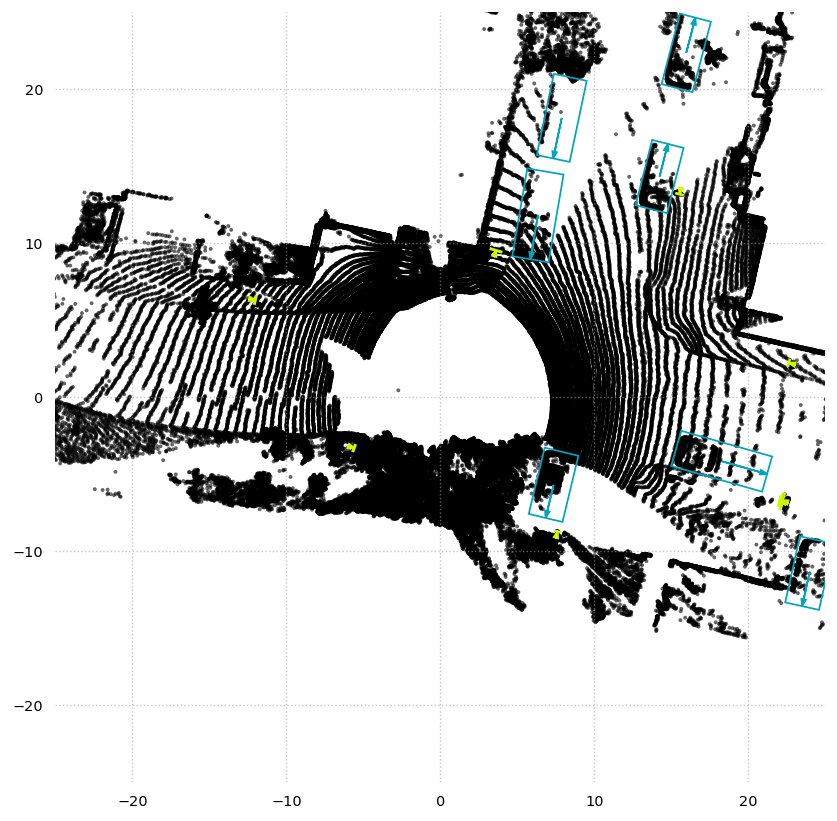
Lidar points and boxes
[8]:
# retrieve point cloud
sample_pcl = dataset.points(seq, frame, coords=lidar, sensor=lidar)
# retrieve boxes in lidar coordinates
sample_annotations = dataset.boxes(seq, frame, coords=lidar)
[9]:
plt.figure(dpi=125, figsize=(8, 8))
plt.scatter(
sample_pcl[:, 0], sample_pcl[:, 1], s=5, c="k", alpha=0.6, edgecolors="none"
)
cmap = gen_discrete_cmap(len(dataset.det_labels))
plot_annotations_bev(
[a.center for a in sample_annotations],
[a.size for a in sample_annotations],
[a.heading for a in sample_annotations],
ax=plt.gca(),
c=cmap([dataset.det_labels.index(a.label) for a in sample_annotations]),
)
plt.xlim(-25, 25)
plt.ylim(-25, 25)
plt.gca().set_aspect("equal")
[10]:
xyz = dataset.points(seq, frame=frame, coords=lidar, sensor=lidar)[:, :3].astype(np.float32)
sample_annotations = dataset.boxes(seq, frame=frame, coords=lidar)
sample_annotations = [a for a in sample_annotations if a.label != "DontCare"]
c = to_k3d_colors(plt.get_cmap("viridis")((xyz[:, 2] + 2) / 4))
plot = k3d.plot(name="pcl", camera_mode="orbit", camera_auto_fit=False)
plot += k3d.points(positions=xyz, point_size=0.07, shader="flat", colors=c)
plot_bboxes_3d(
plot,
[a.transform for a in sample_annotations],
[a.size for a in sample_annotations],
c=0xFF0000,
)
plot.camera = [-0.52, -12.19, 17.0, 4.94, -1.7, 5.19, 0.0, 0.0, 1.0]
plot
/home/ngranger/venvs/tri3d/lib64/python3.12/site-packages/traittypes/traittypes.py:97: UserWarning: Given trait value dtype "int64" does not match required type "float32". A coerced copy has been created.
warnings.warn(
[10]:
[11]:
xyz = dataset.points(seq, frame, sensor=lidar)[:, :3].astype(np.float32)
semantic = dataset.semantic(seq, frame, sensor=lidar)
cmap = gen_discrete_cmap(len(dataset.sem_labels))
c = to_k3d_colors(cmap(semantic)) * (semantic >= 0)
plot = k3d.plot(name="pcl", camera_mode="orbit", camera_auto_fit=False)
plot += k3d.points(positions=xyz, point_size=0.07, shader="flat", colors=c)
plot.camera = [-0.52, -12.19, 17.0, 4.94, -1.7, 5.19, 0.0, 0.0, 1.0]
plot
[11]: